There’s a graphic making the rounds right now. You’ve probably seen it. It’s a radar chart showing the difference between what AI theoretically could do across various job categories versus what people are actually using it for.
It’s striking. The gap between the two is enormous.
And it’s a little scary.
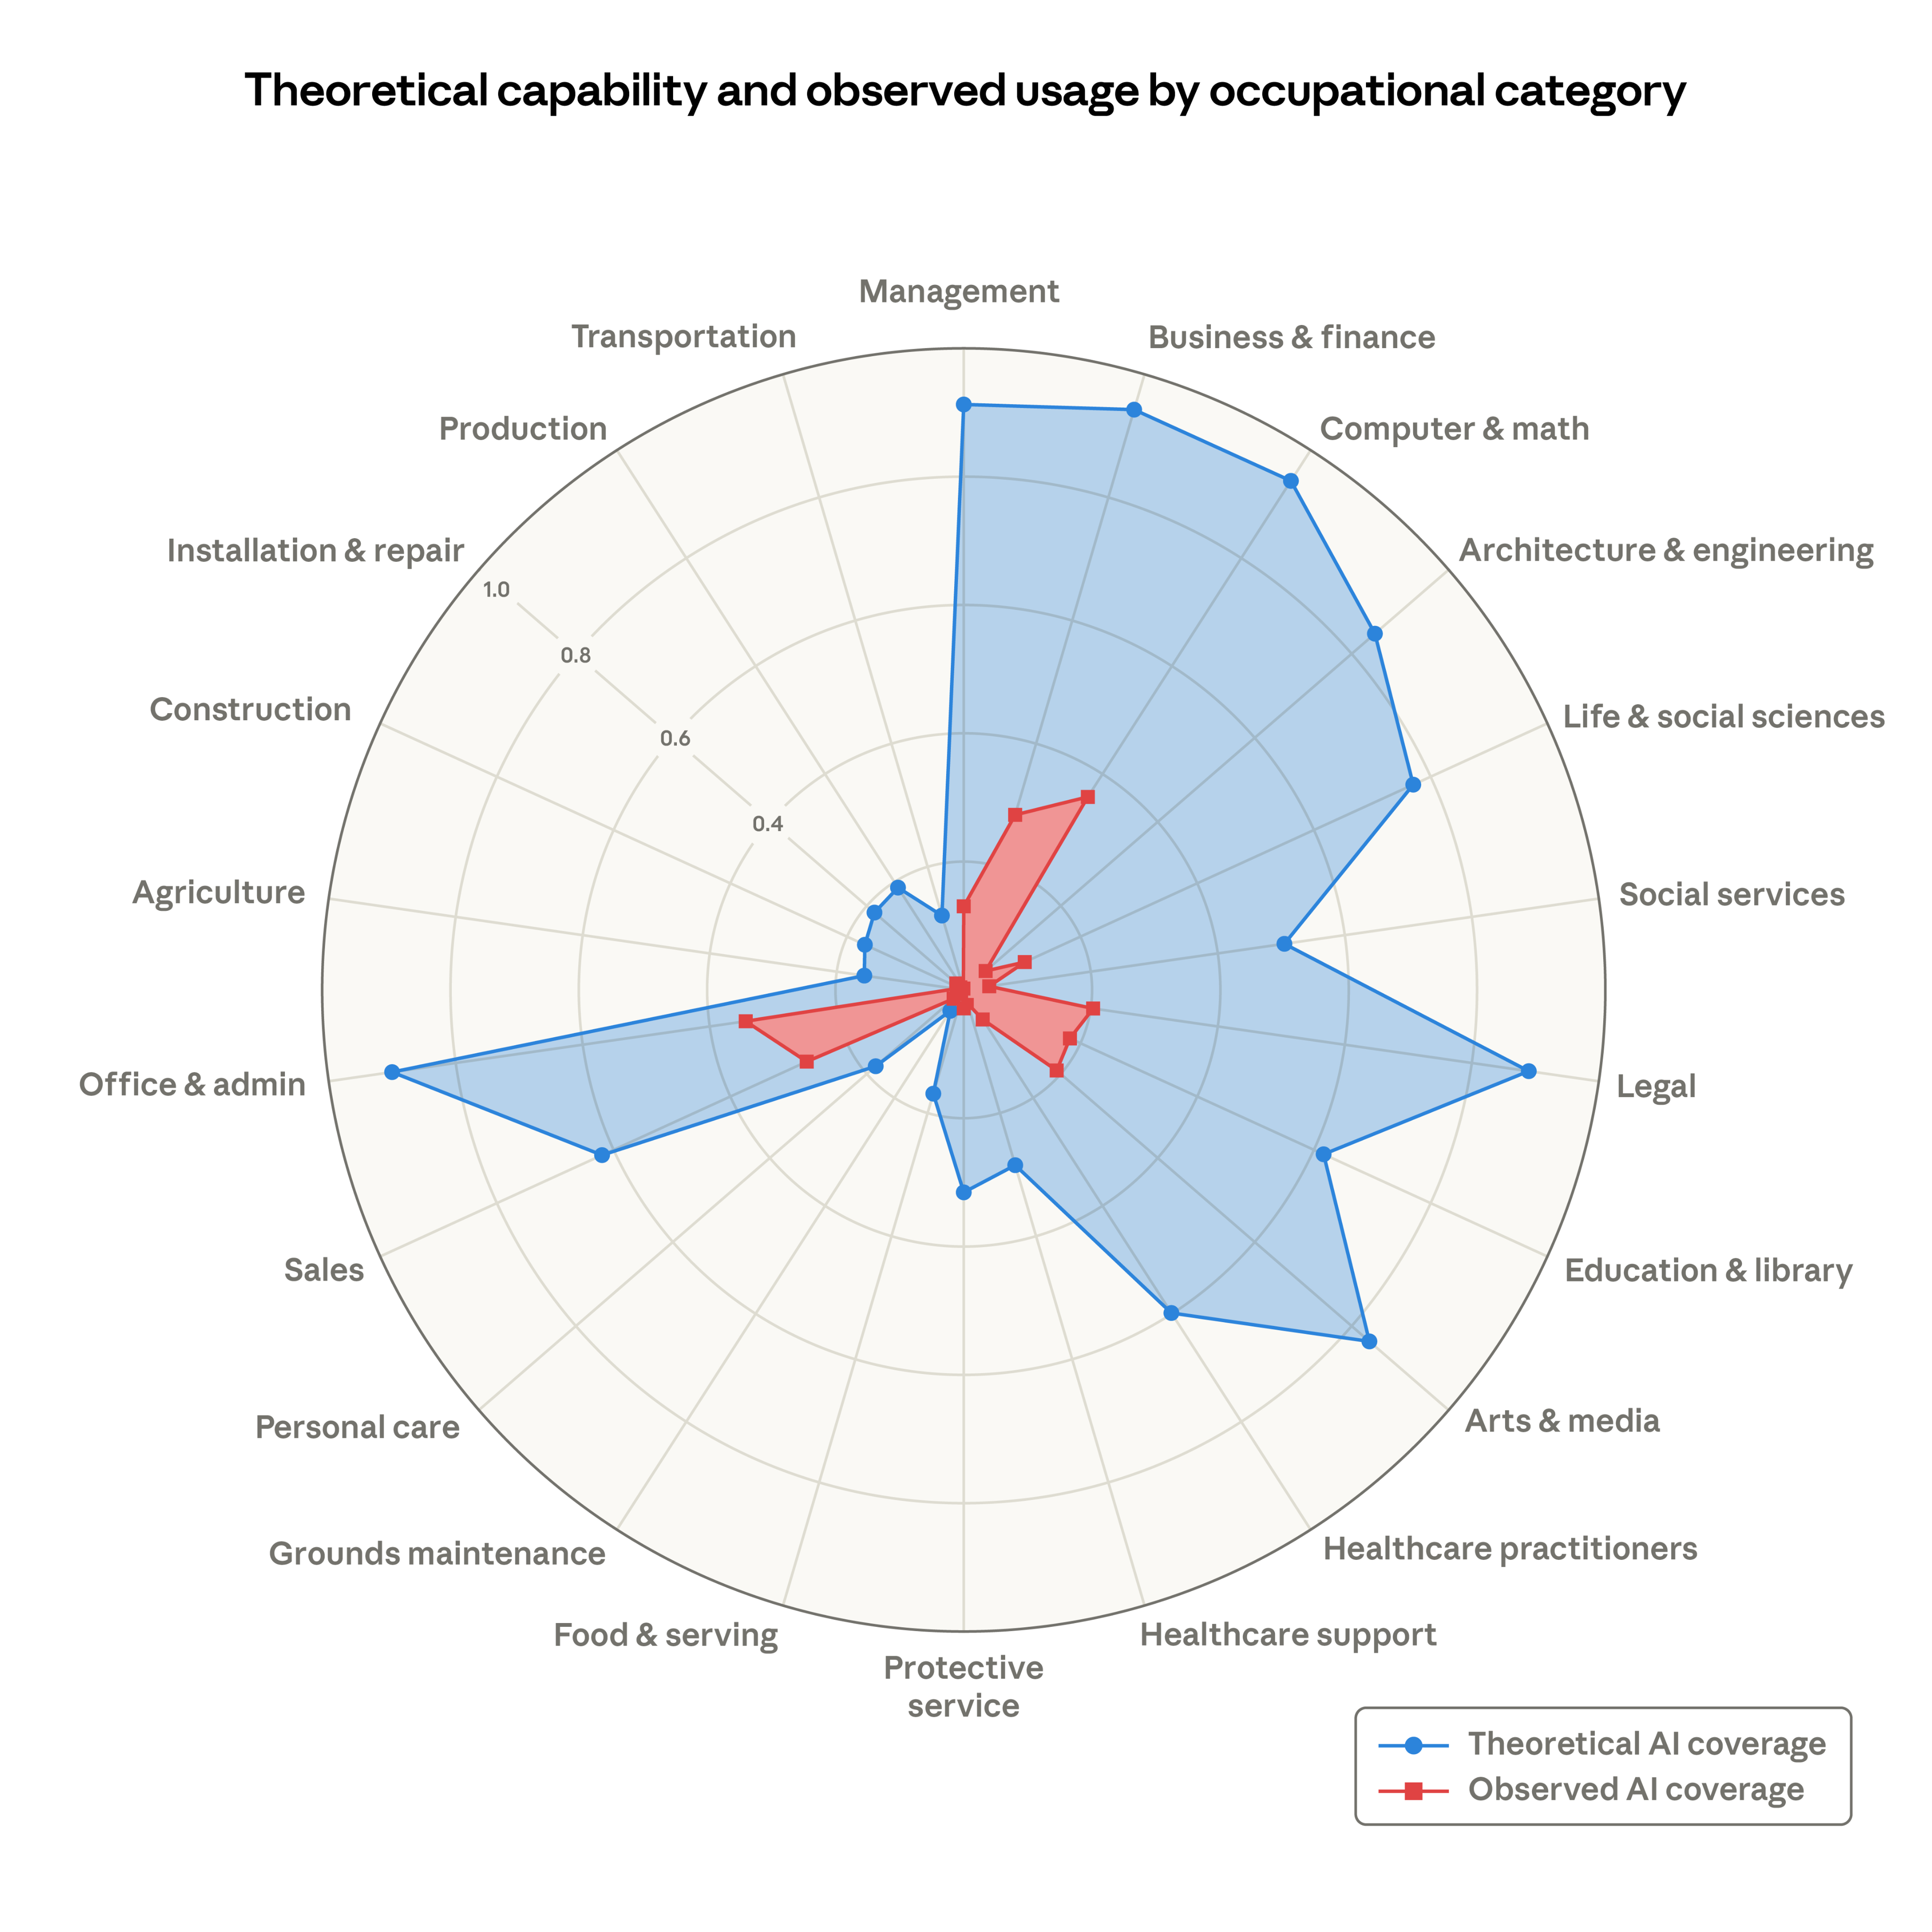
(Source: Anthropic — Labor market impacts of AI: A new measure and early evidence)
The chart shows two overlapping shapes - a large blue area representing AI’s potential and a small orange/amber area representing current AI usage - plotted across categories like Cognitive/Analytical, Creative, Technical, Administrative, Interpersonal/Social, and Physical/Dexterous tasks. The potential area dwarfs the current usage one. It looks like the current usage shape is cowering inside the potential one.
The implication is clear: AI can do way more than we’re using it for. And the visual is effective. You look at it and think, “oh no.”
Why would a company release this?
That’s the first question worth asking. Why would a company release something like this? Is it because they’re ethical and want to warn us? Are they doing us a public service?
That’s how it feels, right? Like they’re being transparent. Like they’re the responsible ones - showing us the truth even though the truth is uncomfortable. You might even admire them for it.
Hold that thought.
You are always being sold to
We have to remember something: we are always being sold to. Always. Every company exists to make a profit. That’s not a criticism - that’s just what the market demands. Companies that don’t grow, die.
But some companies are so good at marketing that you don’t even realize it’s happening. The best ones make it feel like a public service. Like they’re just trying to help. Like they’re the good guys, sharing research with the world out of the goodness of their hearts.
You might even admire them for it. And that’s exactly when you should be paying the most attention.
Let’s actually look at this graphic
Because once you stop reacting to it emotionally and start looking at what it’s actually doing, it gets interesting.
The word “theoretical” is doing a lot of heavy lifting. It sounds humble. Scientific. Measured. But theoretical capability is defined by the company that made the chart, based on what their own models can do. They decided what counts as “capability.” They drew the blue line.
That’s not research. That’s a company mapping its own total addressable market and putting it in a chart.
The gap is the point. That huge space between the blue shape and the red shape? That’s not a warning. It’s a sales pitch. To businesses, it says: “your competitors could be using AI for Legal, Healthcare, Engineering - and they’re not yet. But they will be. Better move fast.” To workers, it says: “AI can theoretically do your job. Are you paying attention?”
That anxiety? It drives adoption. Which drives revenue.
It’s a land-grab narrative dressed as research. The chart positions the company as the authority on what AI can and can’t do - across every industry, every job function. That’s a bold claim to stake out. And it’s presented not as marketing, but as a sober assessment. A public service.
Here’s the translation: what they want you to believe is that the gap represents opportunity. What it actually represents is their TAM - their total addressable market - illustrated as a helpful infographic.
You’re always being sold to
I’m not saying the data is fake. I’m not saying AI isn’t capable. It clearly is. I use it every day and it’s genuinely powerful.
But never forget that you’re always being sold to. When companies make decisions - when contracts are refused publicly, when graphics are released, when executives give interviews making scary predictions about the future - those things are not done without ulterior motive. They are strategic. They are calculated. They are not done in a vacuum.
That’s not cynicism. That’s just how markets work. Companies are obligated to grow. Their investors demand it. And that’s fine.
But as people, we should stay on our toes. Remain skeptical. When you see something that makes you feel anxious or urgent or like you need to act now, ask yourself one question:
Who benefits from me believing this?
You are always being sold to.
This post was dictated by a human and edited by Claude Opus 4.6